Python获取TIOBE排行榜 绘制图表及词云


✨TIOBE
TIOBE排行榜是根据互联网上有经验的程序员、课程和第三方厂商的数量,并使用搜索引擎(如Google、Bing、Yahoo!)以及Wikipedia、Amazon、YouTube统计出排名数据,只是反映某个编程语言的热门程度,并不能说明一门编程语言好不好,或者一门语言所编写的代码数量多少。
TIOBE开发语言排行榜每月更新一次,依据的指数是基于世界范围内的资深软件工程师和第三方供应商提供,其结果作为当前业内程序开发语言的流行使用程度的有效指标。
该指数可以用来检阅开发者的编程技能能否跟上趋势,或是否有必要作出战略改变,以及什么编程语言是应该及时掌握的。观察认为,该指数反应的虽并非当前最流行或应用最广的语言,但对世界范围内开发语言的走势仍具有重要参考意义。
✨目标网站
https://www.tiobe.com/tiobe-index/
✨目标数据
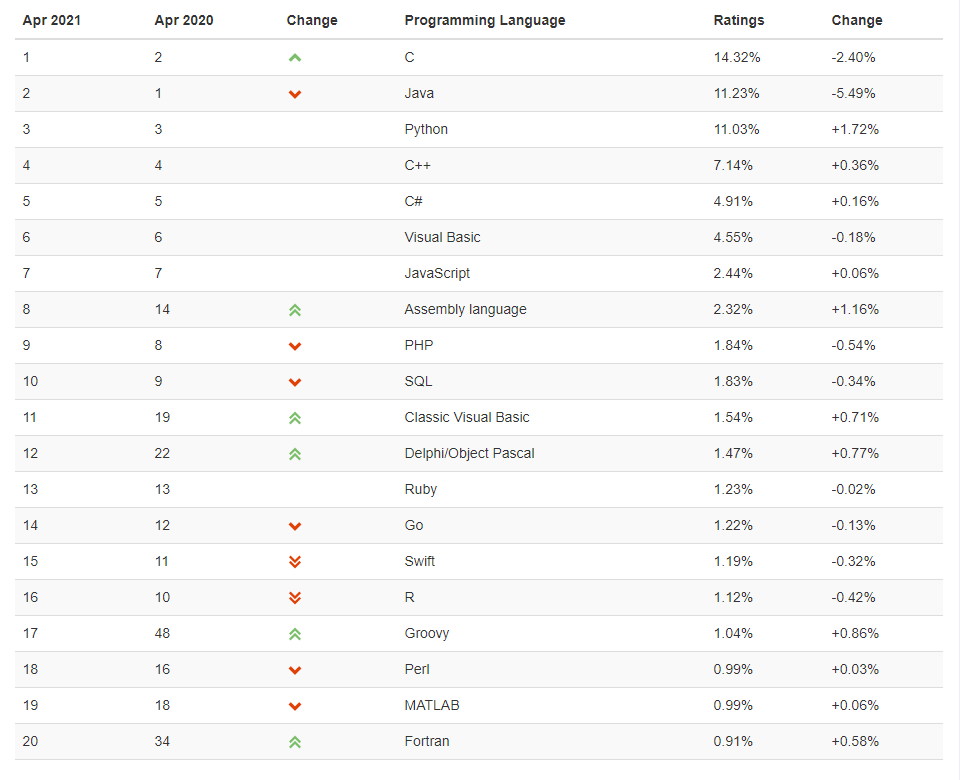
TIOBE Index for April 2021
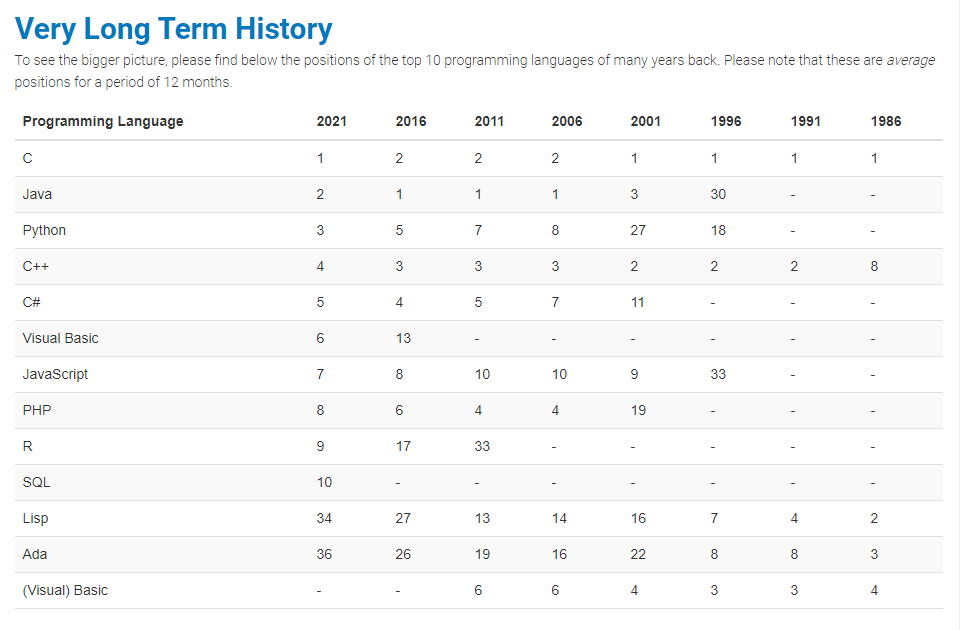
Very Long Term History
✨需求分析
⭐利用Python解析页面信息⭐
⭐分析相关数据绘制图表⭐
⭐保存相关榜单信息⭐
✨绘制图表效果
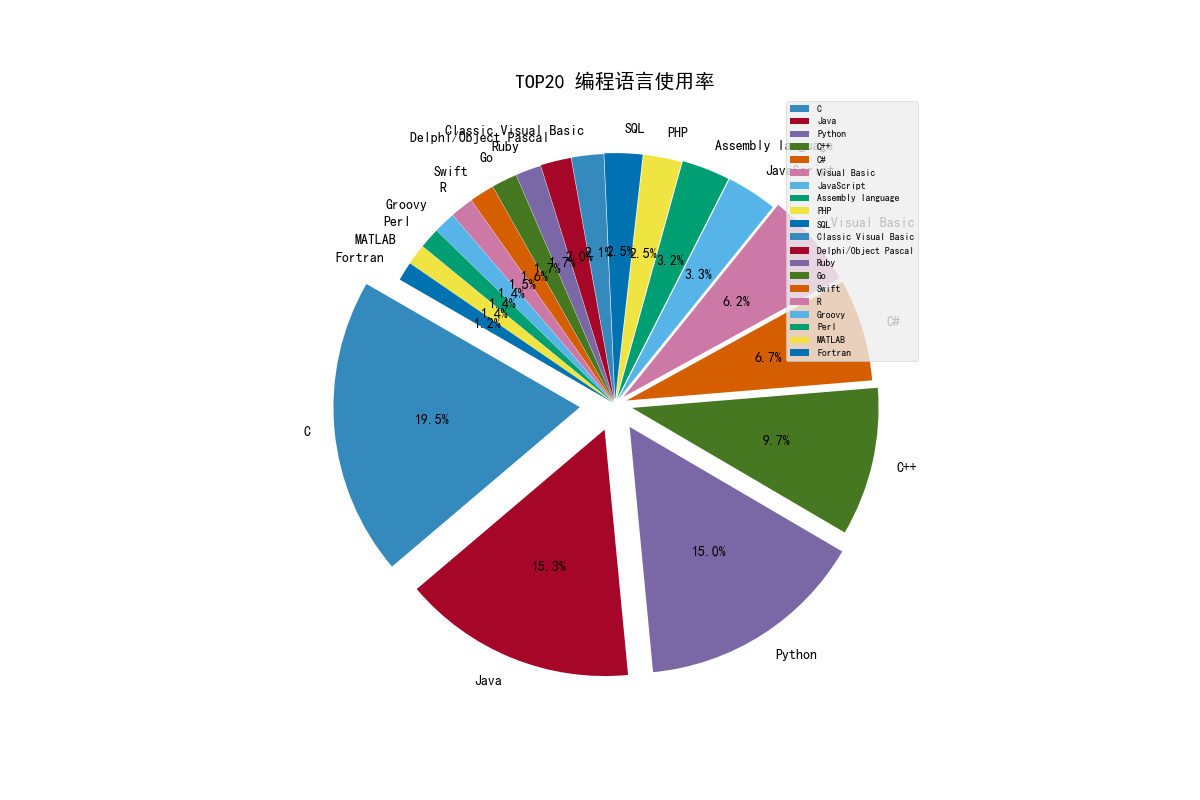
TOP20 编程语言使用率
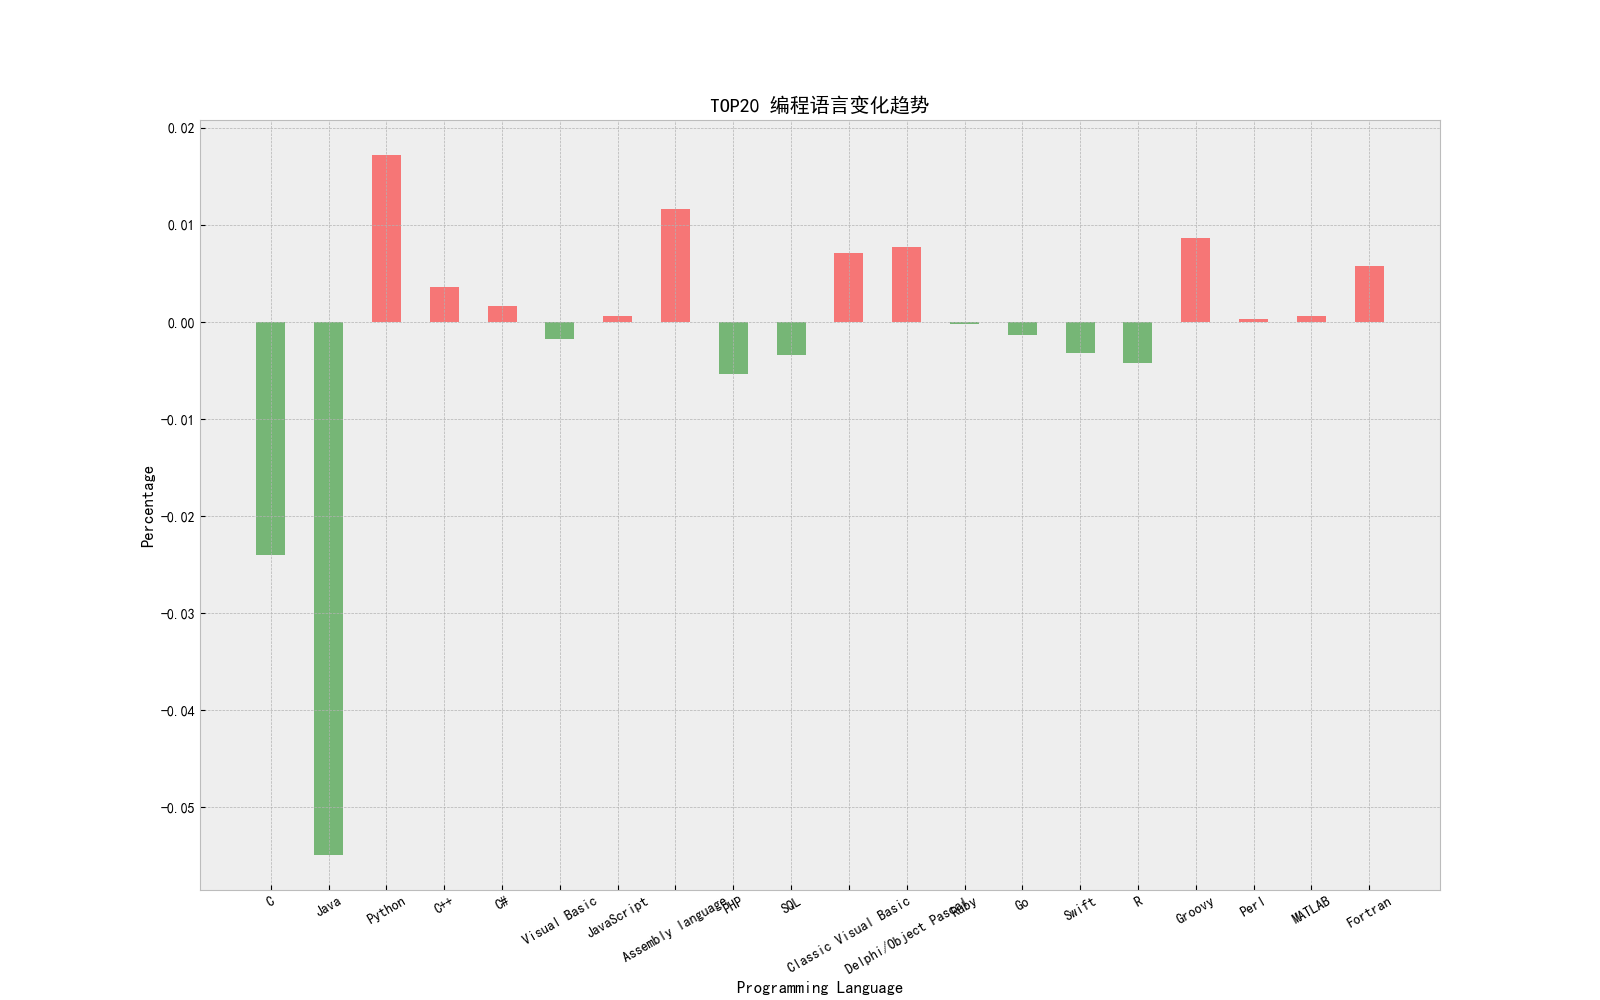
TOP20 编程语言变化趋势
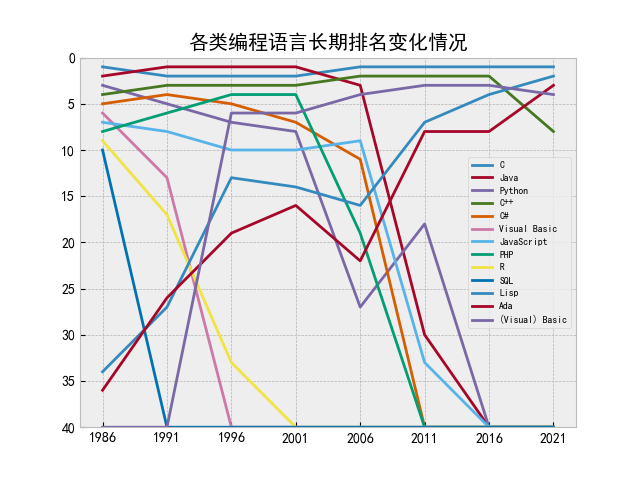
各类编程语言长期排名变化情况
✨绘制词云效果
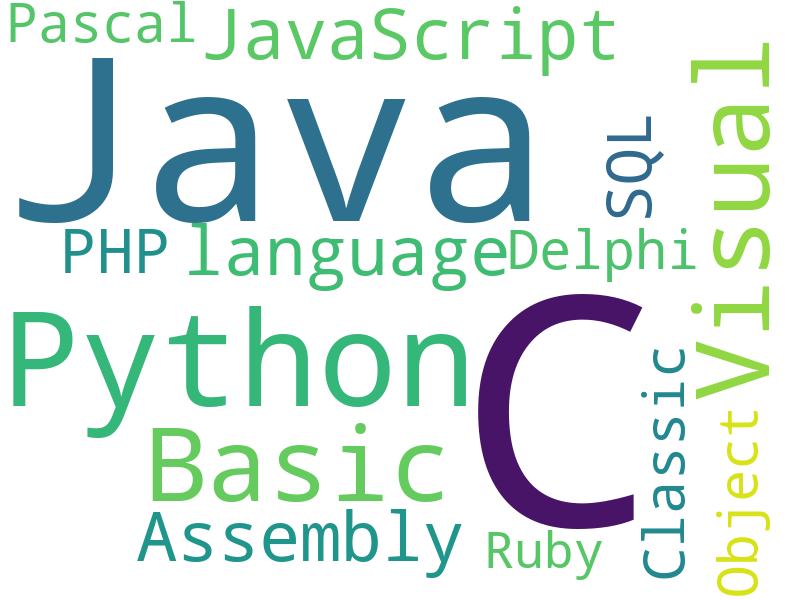
TOP20 编程语言使用率词云
✨代码实现
import requests
from requests.exceptions import RequestException
from lxml import etree
import matplotlib.pyplot as plt
import wordcloud


# 获取html
def getHTMLText(url):
    headers = {
        "user-agent": "Mozilla/5.0 (Windows NT 10.0; Win64; x64) AppleWebKit/537.36 (KHTML, like Gecko) Chrome/67.0.3396.62 Safari/537.36"
    }
    try:
        r = requests.get(url, headers=headers)
        r.raise_for_status()
        r.encoding = r.apparent_encoding
        return r.text
    except RequestException as e:
        print("error", e)


# 解析html
def analyzeRankHtml(html):
    html = etree.HTML(html, etree.HTMLParser())
    uhead = html.xpath("//table[contains(@class,"table-top20")]/thead/tr//text()")
    ulist = html.xpath("//table[contains(@class,"table-top20")]/tbody/tr//text()")
    for i in range(7):
        uhead.remove("
")
    uhead.pop(2)
    # print(uhead)
    # print(ulist)
    return uhead, ulist


# 数据清洗 1
def dataPreTreat1(uinfo: list) -> list:
    language = []
    ratings = []
    change = []

    for i in range(len(uinfo)):
        if i % 5 == 2:
            language.append(uinfo[i])
        elif i % 5 == 3:
            ratings.append(uinfo[i])
        elif i % 5 == 4:
            change.append(uinfo[i])
        else:
            pass

    ratings_data = []
    for i in ratings:
        ratings_data.append(float(i.rstrip("%")) / 100)

    change_data = []
    for i in change:
        change_data.append(float(i.rstrip("%")) / 100)

    return language, ratings_data, change_data


# 打印排行信息
def printRank(uhead, ulist):
    for i in range(len(uhead)):
        if i == 2:
            print("{:^25}	".format(uhead[i]), end="")
        else:
            print("{:^10}	".format(uhead[i]), end="")
    print()

    tplt = "{0:^10}	{1:^10}	{2:^25}	{3:^10}	{4:^10}"

    j = 0
    for i in range(20):
        if i == 0:
            print(tplt.format(ulist[0], ulist[1], ulist[2], ulist[3], ulist[4]))
        else:
            print(tplt.format(ulist[j], ulist[j + 1], ulist[j + 2], ulist[j + 3], ulist[j + 4]))
        j += 5
    print()


# 保存TOP20编程语言情况
def saveRank(uhead, ulist):
    with open("TOP20 编程语言情况.txt", "w+") as f:
        for i in range(len(uhead)):
            if i == 2:
                f.write("{:^25}	".format(uhead[i]))
            else:
                f.write("{:^10}	".format(uhead[i]))
        f.write("
")

        tplt = "{0:^10}	{1:^10}	{2:^25}	{3:^10}	{4:^10}	{5:}"
        j = 0
        for i in range(20):
            if i == 0:
                f.write(tplt.format(ulist[0], ulist[1], ulist[2], ulist[3], ulist[4], "
"))
            else:
                f.write(tplt.format(ulist[j], ulist[j + 1], ulist[j + 2], ulist[j + 3], ulist[j + 4], "
"))
            j += 5

    print("TOP20 编程语言情况.txt 已保存...
")


# 获取各类编程语言长期排名情况
def analyzeVlthHtml(html):
    html = etree.HTML(html, etree.HTMLParser())
    vlth = html.xpath("//table[contains(@id,"VLTH")]//tr//text()")
    vhead = []
    for i in range(9):
        vhead.append(vlth.pop(0))
    # print(vhead)
    # print(vlth)
    return vhead, vlth


# 打印长期排行信息
def printLongTermHistoryRank(vhead, vlth):
    for i in range(len(vhead)):
        if i == 0:
            print("{0:^25}	".format(vhead[i]), end="")
        else:
            print("{:^5}	".format(vhead[i]), end="")
    print()

    tplt = "{0:^25}	{1:^5}	{2:^5}	{3:^5}	{4:^5}	{5:^5}	{6:^5}	{7:^5}	{8:^5}"
    j = 0
    for i in range(13):
        if i == 0:
            print(tplt.format(vlth[0], vlth[1], vlth[2], vlth[3], vlth[4], vlth[5], vlth[6], vlth[7], vlth[8]))
        else:
            print(tplt.format(vlth[j], vlth[j + 1], vlth[j + 2], vlth[j + 3], vlth[j + 4], vlth[j + 5], vlth[j + 6],
                              vlth[j + 7], vlth[j + 8]))
        j += 9
    print()


# 保存各类编程语言长期排名变化情况
def saveLongTermHistoryRank(vhead, vlth):
    with open("各类编程语言长期排名变化情况.txt", "w+") as f:
        for i in range(len(vhead)):
            if i == 0:
                f.write("{0:^25}	".format(vhead[i]))
            else:
                f.write("{:^5}	".format(vhead[i]))
        f.write("
")

        tplt = "{0:^25}	{1:^5}	{2:^5}	{3:^5}	{4:^5}	{5:^5}	{6:^5}	{7:^5}	{8:^5}	{9:}"

        j = 0
        for i in range(13):
            if i == 0:
                f.write(
                    tplt.format(vlth[0], vlth[1], vlth[2], vlth[3], vlth[4], vlth[5], vlth[6], vlth[7], vlth[8], "
"))
            else:
                f.write(
                    tplt.format(vlth[j], vlth[j + 1], vlth[j + 2], vlth[j + 3], vlth[j + 4], vlth[j + 5], vlth[j + 6],
                                vlth[j + 7], vlth[j + 8], "
"))
            j += 9

    print("各类编程语言长期排名情况.txt 已保存...
")


# 数据清洗 2
def dataPreTreat2(vhead, vlth: list) -> list:
    month = []
    for i in range(len(vhead)):
        month.append(vhead[i])
    month.pop(0)
    month.sort()
    # print(month)

    vlth = [40 if i == "-" else i for i in vlth]
    tmp = []
    data = []
    for i in range(13):
        for j in range(9):
            tmp.append(vlth.pop(0))
        # print(tmp)
        data.append(tmp)
        tmp = []
    # print(data)
    language = []
    for i in data:
        language.append(i.pop(0))

    data = [[float(j) for j in i] for i in data]
    # print(language)
    # print(month)
    # print(data)

    return language, month, data


# 绘制图表
def drawPic(ratings_data, change_data):
    print("开始绘制->TOP20 编程语言使用率...
")
    # 解决title中文乱码
    plt.rcParams["font.sans-serif"] = ["SimHei"]  # Windows
    # plt.rcParams["font.sans-serif"] = ["Arial Unicode MS"]  # macOS
    plt.rcParams["axes.unicode_minus"] = False

    # 输出所有可使用style
    # print(plt.style.available)
    # 设置绘图style
    plt.style.use("bmh")

    plt.figure(figsize=(12, 8))
    plt.pie(x=ratings_data, explode=ratings_data, labels=language, autopct="%1.1f%%", normalize=True, shadow=False,
            startangle=150)
    plt.title("TOP20 编程语言使用率")
    plt.legend(loc="best", fontsize="x-small")
    plt.savefig("TOP20 编程语言使用率.png")
    plt.show()
    print("TOP20 编程语言使用率.png 已保存...
")

    print("开始绘制->TOP20 编程语言变化趋势...
")

    color = []
    for i in change_data:
        if i >= 0:
            color.append("red")
        else:
            color.append("green")

    plt.figure(figsize=(16, 10))
    bar_width = 0.5
    plt.bar(language, change_data, bar_width,
            color=color,
            align="center", label="change", alpha=0.5)
    plt.xlabel("Programming Language")
    plt.ylabel("Percentage")
    plt.xticks(rotation=30)
    plt.title("TOP20 编程语言变化趋势")
    plt.savefig("TOP20 编程语言变化趋势.png")
    plt.show()
    print("TOP20 编程语言变化趋势.png 已保存...
")


# 绘制词云图
def drawWordcloud(language, ratings):
    print("开始绘制词云图...
")
    ratings = [i * 1000 for i in ratings]
    # print(ratings)
    words = []
    for i in range(len(language)):
        for j in range(int(ratings[i])):
            words.append(language[i])

    txt = ",".join(words)
    # print(txt)
    w = wordcloud.WordCloud(width=800, height=600, background_color="white",
                            max_words=15,
                            collocations=False
                            )
    w.generate(txt)
    w.to_file("TOP20 编程语言使用率词云.png")
    print("TOP20 编程语言使用率词云.png 已保存...
")


# 绘制折线图
def drawLineChart(language, month, data):
    print("开始绘制->各类编程长期排名情况...
")

    # print(month)
    # print(language)

    # 解决title中文乱码
    plt.rcParams["font.sans-serif"] = ["SimHei"]  # Windows
    # plt.rcParams["font.sans-serif"] = ["Arial Unicode MS"]  # macOS
    plt.rcParams["axes.unicode_minus"] = False

    # 输出所有可使用style
    # print(plt.style.available)
    # 设置绘图style
    plt.style.use("bmh")

    for i in range(len(data)):
        # print(data[i])
        plt.plot(month, data[i], label=language[i])
    plt.title("各类编程语言长期排名变化情况")
    plt.legend(loc="best", fontsize="x-small")
    plt.ylim(0, 40)  # 设置y轴
    plt.gca().invert_yaxis()  # y轴逆序
    plt.savefig("各类编程语言长期排名变化情况.png")
    plt.show()
    print("各类编程语言长期排名变化情况.png 已保存...
")


if __name__ == "__main__":

    url = "https://www.tiobe.com/tiobe-index/"

    print("正在解析页面信息...请稍等...
")

    html = getHTMLText(url)

    uhead, uinfo = analyzeRankHtml(html)

    language, ratings, change = dataPreTreat1(uinfo)

    print("解析:https://www.tiobe.com/tiobe-index/ 获取到 TOP20 编程语言情况如下:
")
    printRank(uhead, uinfo)
    saveRank(uhead, uinfo)
    drawPic(ratings, change)
    drawWordcloud(language, ratings)

    print("正在解析各类编程语言长期排名情况...请稍等...
")

    vhead, vlth = analyzeVlthHtml(html)

    language, month, data = dataPreTreat2(vhead, vlth)

    print("解析:https://www.tiobe.com/tiobe-index/ 获取到 各类编程语言长期排名情况如下:
")

    printLongTermHistoryRank(vhead, vlth)
    saveLongTermHistoryRank(vhead, vlth)
    drawLineChart(language, month, data)
✨参考及引用
https://baike.baidu.com/item/Tiobe/2830870
https://blog.csdn.net/handuoduo123/article/details/105319321
⭐转载请注明出处
本文作者:双份浓缩馥芮白
原文链接:https://www.cnblogs.com/Flat-White/p/14704210.html
版权所有,如需转载请注明出处。
